This is the first article in the Know Your Tools series. Know Your Tools highlights the limitations of commonly used tools and suggests ways to plan around them
Models and bottles on a Friday night? Young professionals may be disappointed to learn that this type of bottle service happens at a desk, not a private table. Financial models are an essential tool in any investor's arsenal, leveraging the power of your microprocessor to forecast valuations and returns.
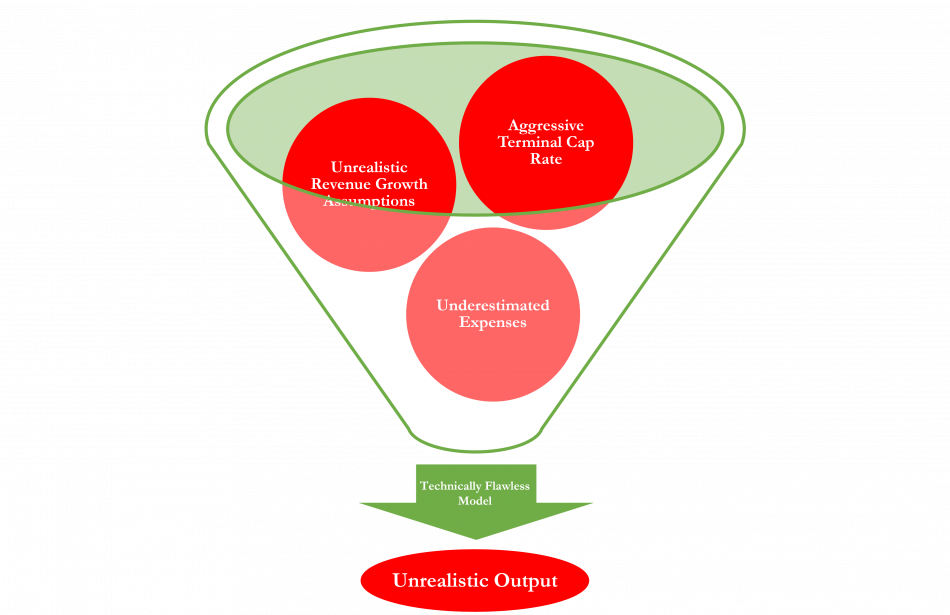
Financial models come in all shapes and sizes. They can be as simple as a few formulas in Excel or as complex as a full-fledged ARGUS ground-up development model. As the level of sophistication increases, there are more places for it to go wrong -- especially if you are putting together your formulas from scratch. Technical errors, while not always easy to diagnose, are not a huge issue. Technical errors can always be resolved with a combination of brain power and elbow grease or by just getting a pre-made template from a professional provider. Technical errors are, to use the NFL's language regarding play reviews, "clear and incontrovertible". This article aims to address the more nuanced, subjective errors.
Computers generally do not make mistakes and technical errors can be fixed, yet investors still do not have a crystal ball into the future. The fundamental problem of financial models is that they rely on a set of assumptions defined by your inputs, and no amount of excel prowess will guarantee that the inputs are any good.
One source of bad inputs is simple bias. For instance, with dry powder ready to deploy and impatient LPs, GPs may face the temptation to cherry pick data to come up with "the right" inputs that make the deal feasible on paper. Obviously, "the right" inputs are not necessarily reflective of reality, they are only reflective of the GP's ideal scenario. Manipulating inputs to get capital out the door is a violation (albeit hard to prove) of the GP's fiduciary duty and, although easier said than done, having a strong ethical system should solve this.
Bias, however, can come in all shapes and sizes. Framing bias can cause an investor to inadvertently choose inaccurate inputs when the investor believes in a particular outcome. For instance, an analyst underwriting a deal that they have been told is a "slam dunk" may unconsciously choose inputs that match up with that description. Alternatively, in a market with explosive growth in valuations, the underwriter may unconsciously only look at aggressive inputs to match comparable valuations.
One way to avoid bias is to take a fundamental approach to finding inputs. But what does that mean?
Research scientists will likely say to follow the evidence to a conclusion rather than having a conclusion in mind to begin with. However, investors may not find this helpful. Chemists may perform experiments in an argon-atmosphere to block out noise and isolate their subject reaction. There are fundamental natural laws that they can expect to hold true. Investors cannot do this -- they deal in a world filled with infinite macro and micro factors that cause noise in forecasts. The laws of physics are a lot more predictable than the laws of a city council. By the time an investor can have relative certainty in a prediction, it is likely that the opportunity has passed.
Real estate investors can overcome these limitations in a few different ways.
Scenario analyses can be used when a project has a few factors that will materially change the outcome. For instance, a retail investor could test scenarios for different anchor tenants in their shopping center. A developer could test scenarios for different zoning decisions. The drawback of scenario analyses is that they do not offer much flexibility -- at their core, these scenarios still require many underlying inputs.
An effective way of overcoming the fundamental issue of inputs is applying sensitivity analysis. Data tables in Excel are likely the easiest way of setting this up. Sensitivity analysis allows an investor to project changes to any variables. Simply set a range -- the above chart has six values for each input, but this is by no means a limit -- and view the results. Sensitivity analysis can be used in tandem with scenario analysis to help get a better idea of potential results. Since it is impossible to say with certainty the value of any input, having a range of probably inputs allows investors to understand the range of outcomes for a deal.
When deciding ranges and observing outcomes, it is most important to take a step back and ask a simple question: "Does this make sense?". This question should be raised at every step in the modeling process. Now, this is not to imply that investors should be reenacting The Big Short every time an opportunity presents itself. That said, asking the high level questions during the more granular parts of deal evaluation can save a lot of time (and money).
Some more specific questions worth considering when asking "does this make sense?" include:
- What is driving this growth? Is it sustainable?
- Who would buy this from me? Would a refinance lender agree with my projections?
- Why has no one else taken advantage of this opportunity?
- This is not a trick question. Unlike stock pickers or derivatives arbitrageurs, real estate investors deal with heterogenous, illiquid assets and can find market inefficiencies without a math PhD from MIT.
Combining financial models with these analyses let investors see a range of outcomes. From there, it is up to the investor to decide if the deal is still attractive. This will vary based upon risk tolerance, investment objectives, and countless other unique factors.
Ultimately, investors must rely on their own common sense and experience for final decisions. Tools are just that: tools. After all, a pilot still looks out the window despite having a cockpit full of instruments.


